Vulcan
Calculation Service
Vulcan provides tools for doing analysis of data in Mount Etna.
Workflows
Workflows integrate calculation and user interactions to produce files, plots, tables and other kinds of outputs. Workflows can be very simple, such as selecting some data and using it to create a visualization, or they can be very complex, like a complete, user-guided single-cell sequencing analysis.
A Vulcan workflow is defined in the Common Workflow Language (CWL, https://www.commonwl.org/user_guide) and runs steps which run Python code or mediate user interactions. Users may interact with workflows in the Vulcan UI, setting input parameters and queueing the workflow to be run by Vulcan. Subsequently the workflow is executed by Vulcan in a sandboxed Python environment called Archimedes.
A workflow consists of a set of primary inputs and a set of steps, each with defined inputs and outputs. The workflow begins with the primary inputs, and each subsequent step depends on either primary inputs or the output of a previous step (producing a directed acyclic graph or DAG).
Here is an example workflow, written in CWL.
 inputs:
   anotherInt:
     type: int
   someInt:
     type: int

 steps:
   calcSum:
     run: scripts/add.cwl
     in:
       a: someInt
       b: anotherInt
     out: [sum]
   pickANum:
     run: ui-queries/int.cwl
     in:
       num: calcSum/sum
     out: [num]
   showSum:
     run: ui-outputs/raw.cwl
     in:
       a: pickANum/num
     out: []
The first step in the example makes the two primary inputs someInt and
anotherInt available to a python script as inputs a and b. Here is the
corresponding Python script add.py:
from archimedes.functions.dataflow import output_path, input_path

a = int(open(input_path('a'), 'r').read())
b = int(open(input_path('b'), 'r').read())

with open(output_path('sum'), 'w') as output_file:
    output_file.write(str(a + b))
When the step writes output to the appropriate file location, it becomes available to subsequent (dependent) steps in the workflow. It also becomes part of Vulcan’s cache.
The second step is a UI query step, which uses output from previous steps to
request input from the user using one of Vulcan’s query widgets (e.g., a text
box with a label returning an integer), allowing the user to make a response
and write it into the cache for subsequent steps. There is no associated
Python code; the Vulcan orchestrator will pass the appropriate instruction to
the UI for ui-queries.
The last step in the example workflow generates output instructions for the Vulcan UI, which can be any of a number of output artifacts: an image, a file download, a table, an interactive plot, etc.
Vulcan Cache
The cache is an ephemeral data store that holds all of the output produced by running workflows. Each step in the workflow, when it completes, stores data in a cache location. On subsequent runs, if there is already a cached output for the step, it will be used instead of rerunning the step. By making use of cached intermediates, Vulcan workflows can minimize the amount of calculation required by iteration.
If the inputs or the script for a step change, the location of the step cache will also change, and Vulcan will look for output in the new location. Note that the “new” location may also be a previously cached state (e.g., if you toggle back and forth between two input values). In addition each workflow session contains a unique key, which if reset will change the cache locations.
Running a Workflow
Workflows can be run in the Vulcan UI. To run a workflow, navigate to your project page from the Vulcan root page. Select one of the available workflows and the Vulcan Workflow UI will appear with a new workflow session.
The interface is divided into three columns.
- On the left, the user may configure primary inputs, or, once the workflow is running, UI query inputs created by the workflow.
- Outputs, such as plots or download links, appear in the second column.
- The final column shows the steps in the workflow in the order they will run (approximately, since the workflow may branch).
The user may change inputs as they see fit; changes will not be persisted to the session until the user saves their edits to each required input using the “Commit” button. Once the session is updated with new inputs, Vulcan will note that some steps in the workflow can be run to produce new outputs and will enable the “Run” button.
Upon running, the workflow will run until it completes, encounters an error, or requires further input from the user to continue.
Visualization with Vulcan
One of the most basic, yet likely to be most used workflow of the Vulcan arsenal, is the Standard Visualization Workflow. This workflow consist of just a few steps where the first is a data query piece (which can be filled in via a Timur-Query) followed by a user input step where the user picks a plot type, then configures how to generate it.
The Plot Configuration Interface
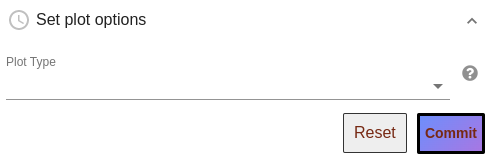
Plot Type Selection: The first step is picking a plot type from among the available options via the dropdown menu shown:
Available Plot Types & Examples:
| scatter_plot | y_plot (violin and box plots) | bar_plot |
|---|---|---|
 |
 |
 |
Primary Features and other options: After plot type selection, plot configuration inputs are displayed, grouped into various expandable categories. Primary Feature inputs, which tell vulcan what columns of data to map to axes, colors, etc., must be filled in and are displayed by default. For example, when setting up a scatter plot you would see:
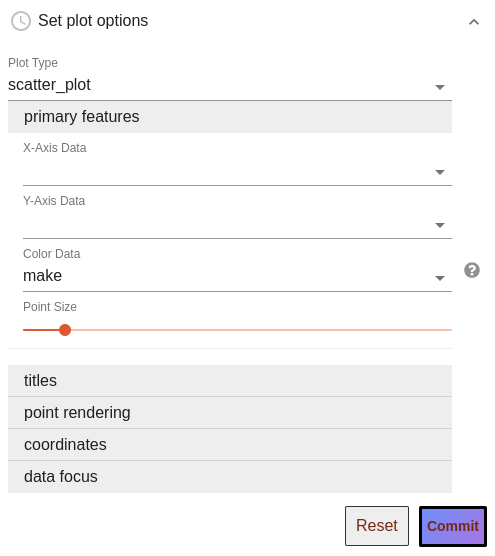
Inputs in other categories will be filled in with intuitive defaults, so can be ignored, but offer tweaks such as title adjustment, log-scaling, and point render reordering.
For an explanation of the role of all inputs, see the table below.
Some notes:
- Often, you will see inputs filled in with ‘make’. ‘make’ is our chosen fill-in for telling the system to “Use the default option,” so leaving such inputs as ‘make’ will let our system fill in that setting with an intuitive default. Such inputs may be adjusted, or not, as needed. (The assumption is that ‘make’ a string which should never map to actual data, but please reach out to the Data Library team if that is ever not that case for you.)
- On occasion, you will encounter plot configuration widgets which look similar, but include reduced configuration options. This is because we designed the system to be configurable by workflow editors. Specifically, workflow editors can provide preset values for any particular input, and any inputs given a preset value are then hidden from the configuration widget. For example, the scRNAseq workflow includes an upstream selection of what data to use for coloring its umap, and a umap is a scatter plot with X and Y axes of the cell’s coordinates. Thus, the configuration step receives presets values for, and hides selection of Plot Type, X-Axis Data, Y-Axis Data, and Color Data.
Inputs of the Plot Configuration Interface
We use a single system to serve the Plot Configuration Interface for all plot types. Thus, even though each plot type requires distinct sets of data mappings and offers a distinct set of advanced options, you can be sure that when a given input does show up, its behaviour will be the consistent across all plot types!
The below table lists all potential inputs and how to use them:
| Label within the Plot Configuration Interface | Plot Types which use these inputs | Purpose & How to use |
|---|---|---|
| X-Axis Data, Y-Axis Data | All | These dropdowns present column names of the incoming data for the user to select which column to use for the X and Y axes. Whereas for Scatter and Y Plots these data are utilized directly, for Bar Plots, plotted data are compositional summaries of Y-Axis Data values per X-Axis Data groups. |
| Color Data | Scatter & Y | This dropdown presents column names of the incoming data for the user to select which column to use for coloring points. The default option ‘make’ will be injected here, which translates to ‘all one color’ for scatter_plots or ‘the X-Axis Data selection’ for y_plots. |
| Scale Y by counts or fraction? | Bar | This dropdown allows users to pick whether the y-axis of the resultant Bar Plot will be in proportion to raw ‘counts’ per group, or to ‘fraction’ composition of each group in which every bar will have a height of 1. |
| Data Representations | Y | The multi-select ui for this input allows users to select which visual representations of their data to show in the plot: either violin plots, box plots, or both. |
| Plot Title, Legend Title, X-Axis Title, Y-Axis Title | All | String inputs which allow the user to provide custom titles. |
| Point render order | Scatter | When ‘Color Data’ is given a discrete data column, this dropdown – of ‘increasing’, ‘decreasing’, or ‘unordered’ – determines both the order by which colors get asigned to groups and their plotting order from back-to-front. |
| Follow selected render ordering when color is continuous? | Scatter | When ‘Color Data’ is given a numeric data column, this checkbox input controls whether to follow the ‘Point render order’ selection for ordering the rendering of data points from back-to-front. |
| Point Size | Scatter | This slider adjusts how large data points will be in scatter plots |
| Adjust scaling of the X-Axis?, Adjust scaling of the Y-Axis? | Scatter & Y | These dropdowns allow the user to change the scaling of the x and/or y axes from the default of ‘linear’ scaling, into log10 scaling via two options: ‘log10’ simply converts scaling to log-scale; ‘log10(val+1)’ adds 1 to all values then converts scaling to log-scale, thus allowing data with zeros (log(0) essentially translates to negative infinity!) to render more intuitively. |
| Focus on a subset of the incoming data? | All | This initally simple checkbox input, which expands into a much more detailed structure when enabled, allows the user to select a subset of rows of the incoming data to focus their plot on. In the expanded form, the user is able to construct one or more conditions that must be met in order for a given data point / row of the data frame to be plotted. Within this UI: ‘Condition #, Feature’ dropdowns select what column of data to focus on for the given condition’s definition. Once this target data is selected, type-dependent UI pieces show up to allow the user to select what data values to keep. Additional conditions can be added with the ‘Add another condition?’ button. Any number of additional conditions can be added, depending your needs. Each new condition will come with one new piece, a ‘Combination Logic:’ dropdown which can be set to either ‘and’ or ‘or’. The combination logic determines whether data points need to pass both the preceding and current condition (‘and’) versus just one (‘or’). When many ‘and’s or ‘or’s are needed, it’s useful to know that the way this logic is parsed here is as if any adjacent ‘and’s are wrapped within parenthesis, with ‘or’s being calculated afterward. So if 5 conditions are used and linked by ‘or’, ‘and’, ‘or’, ‘and’, the effective check will be: (condition1) OR (condition2 AND condition3) OR (conditon4 AND condition5). |